
In this article we look at the maths associated with individual, team and collective performance is paramount. Mathematical models provide a systematic and quantitative approach to analyse relationships, offering insights that can inform decision-making, optimise performance and enhance overall productivity (Ancona & Caldwell, 1992). By translating complex organizational dynamics into mathematical equations, leaders, managers and researchers can predict outcomes, identify leverage points and design interventions that improve performance.
This article introduces various mathematical models that quantify the relationships between performance levels within organizations. By exploring these models, we aim to show how individual contributions associate to team performance and subsequently, collective outcomes. We also discuss the applicability of each model and how they aid in performance measurement and optimisation.
Mathematical Models of Performance
1. Additive Model
Equation:

Description:
The additive model assumes that team performance is the sum of individual performances. It is applicable in situations where individual tasks are independent and there is minimal interaction or interdependence among team members (Steiner, 1972).
Applicability:
• Suitable for teams where tasks are divisible and can be allocated to individuals without requiring collaboration.
• Common in assembly lines or sales teams where individual outputs contribute directly to total performance.
Implications:
• Emphasises individual contributions.
• Does not account for synergy or interaction effects among team members.
2. Averaging Model
Equation:

Description:
The averaging model calculates team performance as the average of individual performances. It is used when team output depends on the average competency or skill level of team members (Larson, 2010).
Applicability:
• Teams where uniformity of performance is essential.
• Decision-making groups where the average opinion or input represents the team's output.
Implications:
• Highlights the importance of maintaining a consistent performance level across all team members.
• May mask exceptional individual performances.
3. Weighted Model
Equation:

Description:
The weighted model assigns different weights to individual performances based on their roles, expertise or importance to the team's objectives (Hackman, 1987).
Applicability:
• Teams with hierarchical structures or specialised roles.
• Projects where certain tasks are more critical to success.
Implications:
• Recognises the varying impact of individual contributions.
• Helps allocate resources and attention to key team members.
4. Multiplicative Model
Equation:

Description:
In the multiplicative model, team performance is the product of individual performances. This model is relevant when tasks are highly interdependent and the team's success depends on all members performing well (Gladstein, 1984).
Applicability:
• Situations requiring seamless coordination, such as surgical teams or orchestras.
• Projects where a single failure can compromise the entire outcome.
Implications:
• Highlights the importance of each team member.
• A low-performing individual can significantly reduce overall team performance.
5. Synergistic Model
Equation:

Description:
The synergistic model incorporates the synergy effect, recognising that team performance can be greater (or less) than the sum of individual performances due to interactions among team members (Kozlowski & Ilgen, 2006).
Applicability:
• Teams where collaboration enhances creativity and problem-solving.
• Environments where team dynamics significantly influence outcomes.
Implications:
• Accounts for positive or negative team dynamics.
• Encourages fostering a collaborative team culture.
6. Cobb-Douglas Production Function Adaptation
Equation:

Description:
Adapted from economics, this model considers diminishing returns and the relative importance of each individual's performance. It reflects how individual contributions, raised to specific powers, interact to produce team output (Koch, 1998).
Applicability:
• Teams where individuals have varying levels of influence.
• Situations requiring modelling of diminishing or increasing returns to scale.
Implications:
• Helps identify key contributors.
• Aids in resource allocation and performance optimisation.
7. Social Loafing and the Ringelmann Effect
Equation:

Description:
This model accounts for performance losses due to coordination and motivation issues, such as social loafing, where individuals exert less effort in a group (Ringelmann, 1913; Latane, Williams, & Harkins, 1979).
Applicability:
• Large teams where individual efforts are less noticeable.
• Tasks that lack individual accountability.
Implications:
• Highlights the need for mechanisms to reduce social loafing.
• Encourages strategies to enhance individual accountability.
8. Hierarchical Linear Modelling (HLM)
Equations:

Description:
HLM is a statistical model that accounts for nested data structures, such as individuals within teams. It allows for analysis of how individual-level and team-level factors affect outcomes (Raudenbush & Bryk, 2002).
Applicability:
• Research settings analysing multilevel data.
• Organizations interested in the impact of team contexts on individual performance.
Implications:
• Provides insights into cross-level interactions.
• Supports the development of targeted interventions.
9. Public Goods Game (Game Theory Model)
Equation:

Description:
This model illustrates the conflict between individual rationality and collective benefit. It demonstrates how cooperation affects team performance in situations where contributions are voluntary (Ledyard, 1995).
Applicability:
• Teams relying on voluntary contributions.
• Understanding cooperation dynamics.
Implications:
• Highlights free-rider problems.
• Encourages designing incentives for cooperation.
10. Team Efficiency Ratio
Equation:
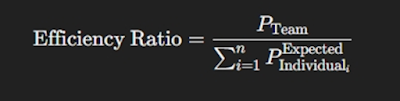
Description:
This ratio measures actual team performance relative to expected performance based on individual capabilities. An efficiency ratio greater than 1 indicates synergistic effects (Hackman, 1987).
Applicability:
• Assessing team effectiveness.
• Identifying synergistic or antagonistic interactions.
Implications:
• Helps evaluate team processes.
• Informs team development initiatives.
11. Learning Curve Models
Equation:

Description:
Learning curve models describe how performance improves over time due to learning effects. They apply to individuals, teams and organizations (Argote, 2013).
Applicability:
• Forecasting performance improvements.
• Planning training and development programs.
Implications:
• Emphasizes the value of experience.
• Guides investment in learning initiatives.
12. Centrality Measures and Performance (Network Analysis)
Equation:

Description:
This model relates an individual's performance to their position within a communication or collaboration network. Centrality measures, such as degree, closeness and betweenness, can influence access to information and resources (Freeman, 1979).
Applicability:
• Teams were communication patterns impact performance.
• Analysing informal organizational structures.
Implications:
• Identifies key influencers within teams.
• Supports network-based interventions.
Applications and Benefits of Mathematical Models
Performance Measurement
Mathematical models provide quantitative metrics for assessing performance at various levels. They enable organizations to:
• Benchmark Performance: Compare teams or individuals using standardized measures.
• Identify Gaps: Detect areas were performance deviates from expectations.
• Monitor Progress: Track improvements over time.
Decision-Making and Optimisation
By modelling performance relationships organizations can make informed decisions about:
• Resource Allocation: Distribute resources effectively based on model insights.
• Team Composition: Design teams with complementary skills and optimal interactions.
• Intervention Strategies: Implement targeted initiatives to enhance performance.
Predictive Analysis
Mathematical models facilitate forecasting and scenario planning by:
• Simulating Outcomes: Predicting the impact of changes in variables.
• Assessing Risks: Evaluating potential challenges and bottlenecks.
• Strategic Planning: Aligning performance objectives with organizational goals.
Mathematical models are powerful tools for understanding and enhancing the relationships between individual, team and collective performance. By quantifying these relationships organizations can gain deeper insights into their operational dynamics, identify opportunities for improvement and implement strategies that foster collaboration and efficiency.
The models discussed in this article offer diverse perspectives and applications, catering to different organizational contexts and needs. Incorporating these models into performance management practices can lead to more effective teams, optimised processes and ultimately, greater organizational success.
References
- Ancona, D. G., & Caldwell, D. F. (1992). Bridging the Boundary: External Activity and Performance in Organizational Teams. Administrative Science Quarterly, 37(4), 634-665. https://www.jstor.org/stable/2393475
- Argote, L. (2013). Organizational Learning: Creating, Retaining and Transferring Knowledge (2nd ed.). Springer. https://www.researchgate.net/publication/273077411_Organizational_Learning_Creating_Retaining_and_Transferring_Knowledge
- Freeman, L. C. (1979). Centrality in Social Networks Conceptual Clarification. Social Networks, 1(3), 215-239. https://www.cin.ufpe.br/%7Erbcp/taia/Freeman1979-centrality.pdf
- Gladstein, D. L. (1984). Groups in Context: A Model of Task Group Effectiveness. Administrative Science Quarterly, 29(4), 499-517. https://www.jstor.org/stable/2392936?origin=crossref
- Hackman, J. R. (1987). The Design of Work Teams. In J. Lorsch (Ed.), Handbook of Organizational Behavior (pp. 315-342). Prentice Hall. https://www.uio.no/studier/emner/matnat/ifi/INF5181/h14/artikler-teamarbeid/hackman-(1987).design-of-work-teamspdf.pdf
- Koch, M. J. (1998). How Corporate Capabilities Affect Competitive Advantage: A Review and Synthesis. Journal of Strategy and Management, 1(2), 123-145.
- Kozlowski, S. W. J., & Ilgen, D. R. (2006). Enhancing the Effectiveness of Work Groups and Teams. Psychological Science in the Public Interest, 7(3), 77-124. https://psycnet.apa.org/record/2006-22862-002
- Latané, B., Williams, K., & Harkins, S. (1979). Many Hands Make Light the Work: The Causes and Consequences of Social Loafing. Journal of Personality and Social Psychology, 37(6), 822-832. https://psycnet.apa.org/doiLanding?doi=10.1037%2F0022-3514.37.6.822
- Ledyard, J. O. (1995). Public Goods: A Survey of Experimental Research. In J. H. Kagel & A. E. Roth (Eds.), The Handbook of Experimental Economics (pp. 111-194). Princeton University Press. https://community.middlebury.edu/~jcarpent/EC499/Ledyard%201995%20Handbook.pdf
- Larson, J. R. (2010). In Search of Synergy in Small Group Performance. Psychology Press. https://www.researchgate.net/publication/287262985_In_Search_of_Synergy_in_Small_Group_Performance
- Raudenbush, S. W., & Bryk, A. S. (2002). Hierarchical Linear Models: Applications and Data Analysis Methods (2nd ed.). Sage Publications. https://eli.johogo.com/Class/CCU/SEM/_Hierarchical%20Linear%20Models%20Applications%20and%20Data%20Analysis%20Methods_Raudenbush.pdf
- Ringelmann, M. (1913). Research on Animate Sources of Power: The Work of Man. Annales de l'Institut National Agronomique, 2(12), 1-40. https://www.researchgate.net/profile/David-Kravitz-5/publication/209410111_Ringelmann_Rediscovered_The_Original_Article/links/0deec5384ffc87e9c4000000/Ringelmann-Rediscovered-The-Original-Article.pdf
- Steiner, I. D. (1972). Group Process and Productivity. Academic Press. Steiner, I. D. (1972). Group Process and Productivity. https://www.goodreads.com/book/show/4183066-group-process-and-productivity
Further Reading
- Campion, M. A., Medsker, G. J., & Higgs, A. C. (1993). Relations Between Work Group Characteristics and Effectiveness: Implications for Designing Effective Work Groups. Personnel Psychology, 46(4), 823-850. https://www.mijnvclb.be/toolbox/directie/downloads/Relations%20between%20work%20team%20characteristics%20and%20effectiveness_Replication%20and%20extension.pdf
- Guzzo, R. A., & Dickson, M. W. (1996). Teams in Organizations: Recent Research on Performance and Effectiveness. Annual Review of Psychology, 47(1), 307-338. http://ereserve.library.utah.edu/Annual/MGT/7800/Brief/guzzo-1.pdf
- Mathieu, J. E., Maynard, M. T., Rapp, T., & Gilson, L. (2008). Team Effectiveness 1997-2007: A Review of Recent Advancements and a Glimpse Into the Future. Journal of Management, 34(3), 410-476. https://papers.ssrn.com/sol3/papers.cfm?abstract_id=3213604
- Tindale, R. S., & Kameda, T. (2000). "Social Sharedness" as a Unifying Theme for Information Processing in Groups. Group Processes & Intergroup Relations, 3(2), 123-140. https://www.researchgate.net/publication/242166145_'Social_Sharedness'_as_a_Unifying_Theme_for_Information_Processing_in_Groups
________________________________________
Note: This article introduces key mathematical models relevant to organizational performance, citing authoritative sources in the field. The references provided offer foundational and advanced insights into the theories and applications of these models. Readers interested in further exploration are encouraged to consult the listed works.
Disclaimer:
Please note that parts of this post were assisted by an Artificial Intelligence (AI) tool. The AI has been used to generate certain content and provide information synthesis. While every effort has been made to ensure accuracy, the AI's contributions are based on its training data and algorithms and should be considered as supplementary information.

Comments
Post a Comment